

The best tools for a Van Westendorp Price Sensitivity Meter
In a competitive marketplace, understanding what customers are willing to pay for your product or service is crucial. The Van Westendorp Price Sensitivity Meter (PSM) is one of the common pricing research methods used to determine the optimal price point and price range. It helps to guide pricing strategy for products or services. By understanding perceptions at different price points and mapping subsequent price curves, it allows businesses to gauge buyer demand and sensitivity to pricing.
There are several statistical software tools available to help you leverage a Van Westendorp Price Sensitivity Meter. This article explores the pros and cons of each, and how they can help in pricing research.
Understanding the Van Westendorp Price Sensitivity Meter
A Van Westendorp Price Sensitivity Meter calculates the acceptable range of prices by understanding demand and sensitivity at a range of price points. The framework is also adaptable, based on whether profitability or volume is a company’s priority.
Van Westendorp Pricing Questions
Market researchers begin with a survey that asks respondents four key questions related to pricing:
At what price would you consider the product to be too expensive?
At what price would you consider the product to be too cheap?
At what price would you consider the product to be expensive but still a viable option?
At what price would you consider the product to be good value?
The answers to these questions are then plotted to create a series of price curves. These curves help identify the acceptable price range, the indifference price point, and the points of marginal expensiveness and cheapness. This price sensitivity analysis helps businesses understand the elasticity of demand and make informed pricing decisions.
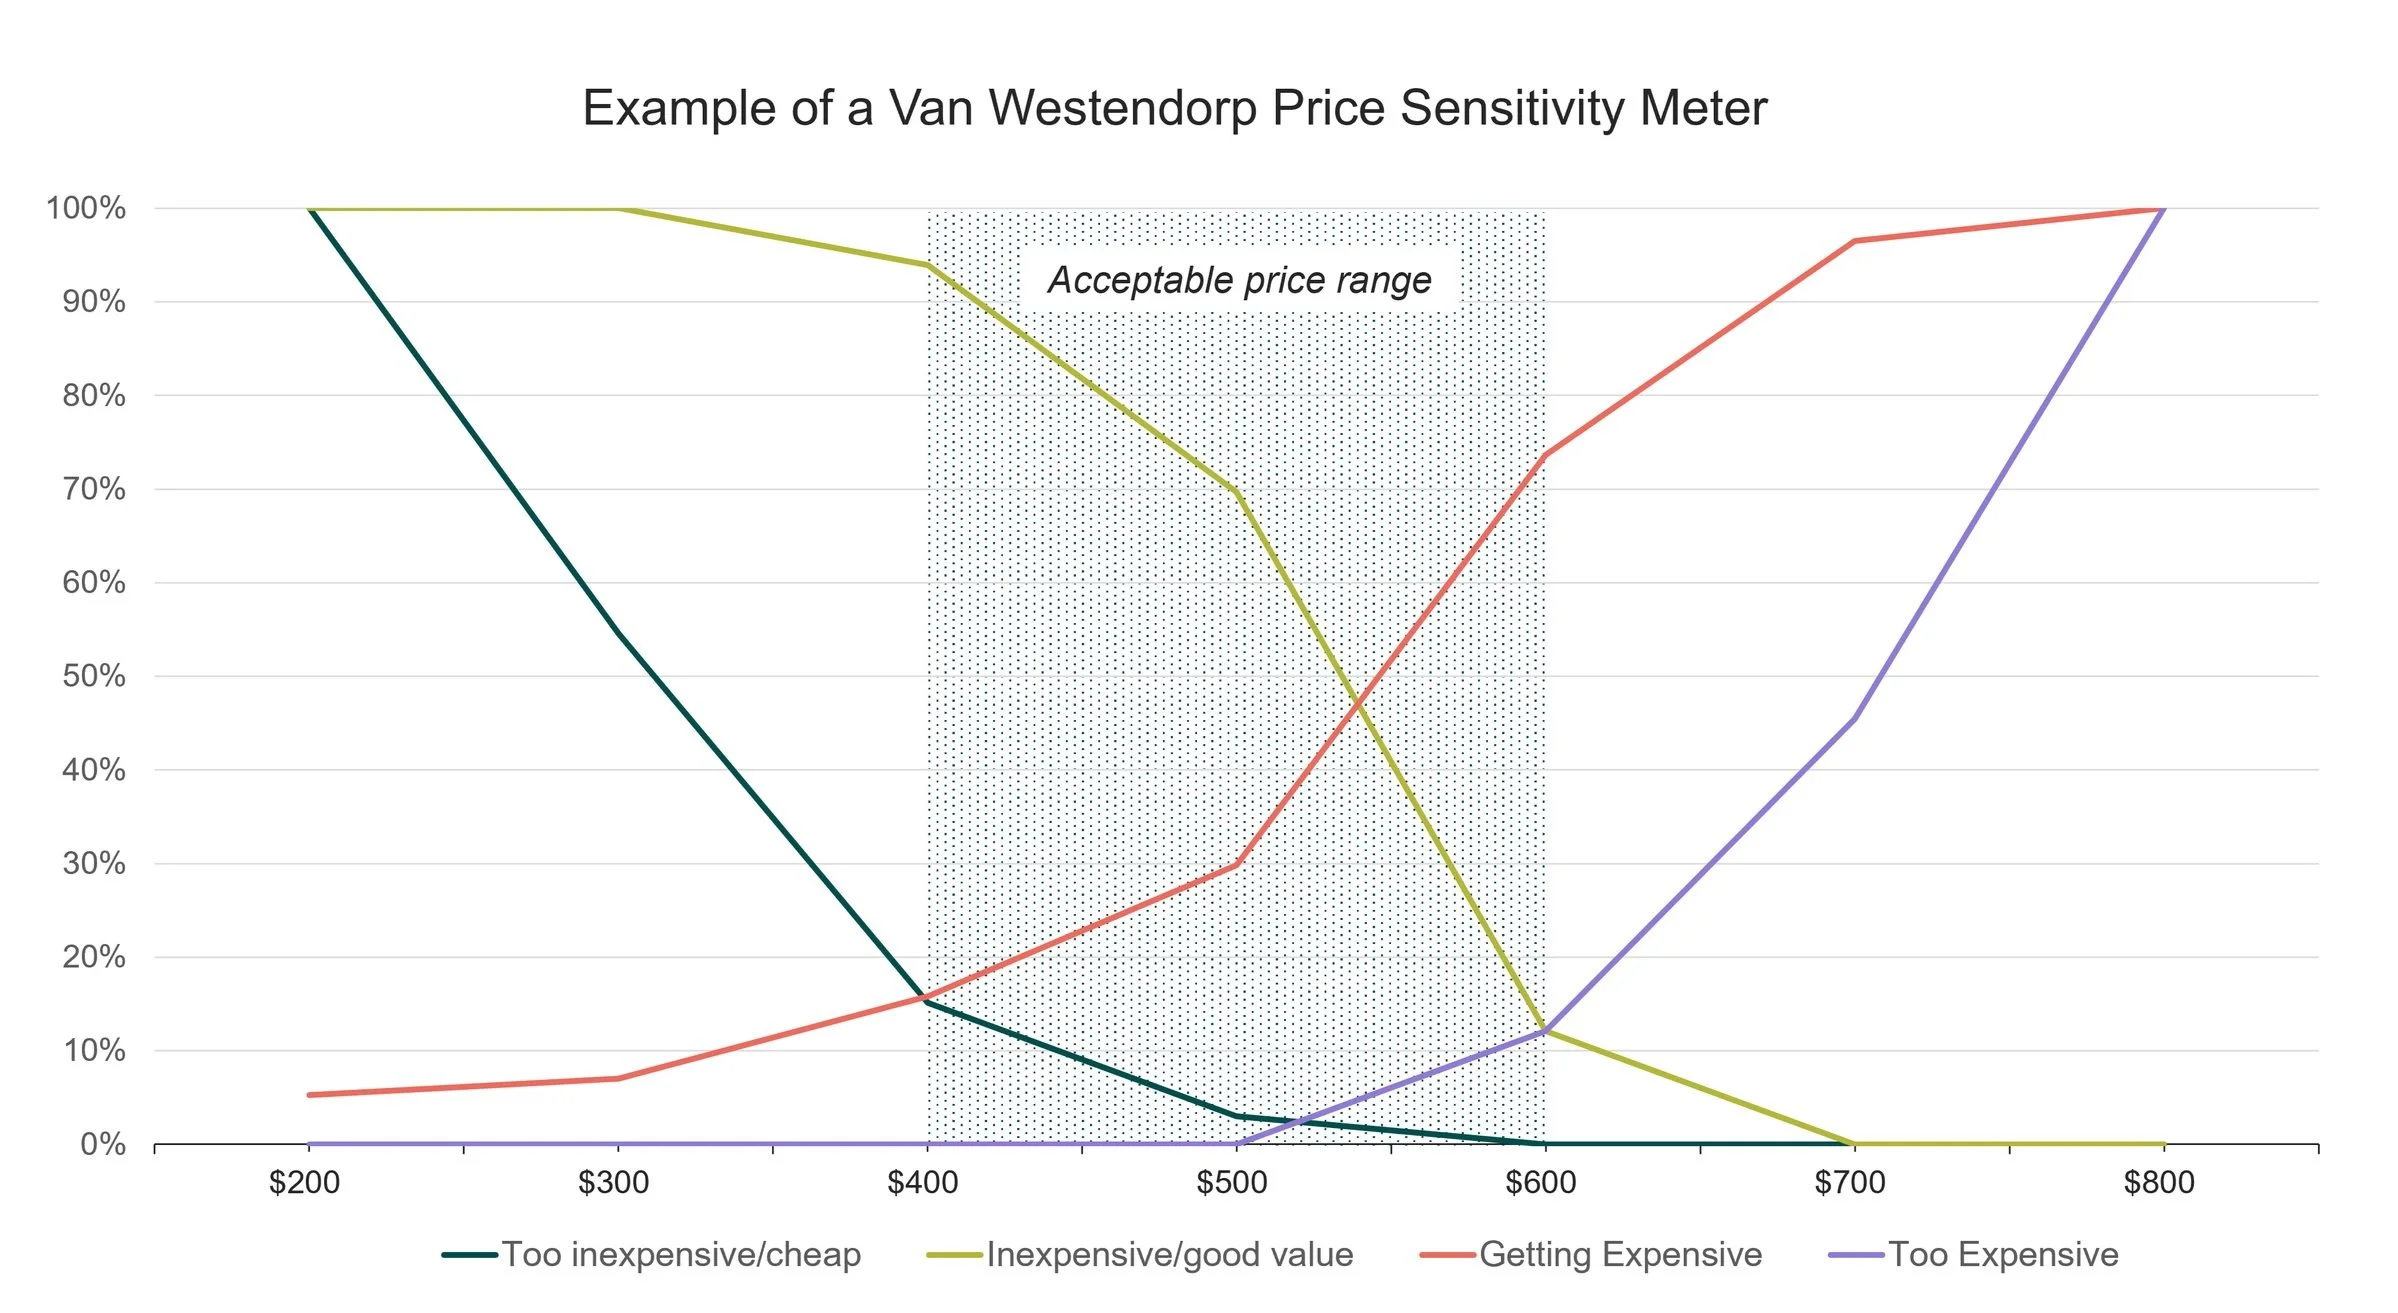
Image: An example of the Van Westendorp Price Sensitivity Meter
Selecting the Best Tool for a Van Westendorp Pricing Model
When choosing a statistical software tool to conduct a Van Westendorp analysis, several factors should be considered. These include cost, user-friendliness, data visualization capabilities, integration with other systems, and the ability to handle large datasets.
Based on our experience, these are the best tools for conducting Van Westendorp analysis:

Q Research Software
Q Research Software is a survey and data analysis platform designed and used by agencies for comprehensive market research. Its advanced features make it particularly suitable for conducting price sensitivity analyses using methodologies like the Van Westendorp Price Sensitivity Meter.
Pros of using Q Research Softwares
Advanced Analytics Features: Q offers robust analytics tools that can effectively process and analyze survey data, helping to derive meaningful insights about pricing perceptions.
Market Segmentation: The platform supports market segmentation, allowing businesses to analyze price sensitivity across different demographics or buyer groups.
Comprehensive Reporting: Users can generate detailed reports that highlight the key findings from their surveys, aiding in strategic decision-making.
Cons of using Q Research Software:
Cost Factors: While Q offers value, costs can be a concern for smaller businesses or startups with limited budgets, especially if advanced features are needed.
Learning Curve: Although user-friendly, there may still be a learning curve for new users to fully utilize all the features and capabilities of the platform.

IBM SPSS Statistics
IBM SPSS Statistics (SPSS) is a powerful platform for analyzing buyer pricing perceptions. The advanced statistical capabilities and data management features make it a great option for detailed market research and informed pricing strategies. However, researchers should consider the cost and complexity of the software.
Pros of using SPSS:
Advanced Statistical Analysis: SPSS offers robust statistical tools, enabling in-depth analysis of complex datasets and accurate insights into pricing perceptions.
Graphical Capabilities: The software provides excellent visualization options to create clear and informative graphs that represent price curves effectively.
Data Management: SPSS excels at handling large datasets, making it suitable for extensive market research projects involving numerous respondents.
Flexible Data Processing: SPSS can accommodate different data formats, making it versatile in integrating data from various sources.
Cons of using SPSS:
Cost Considerations: SPSS can be quite expensive, especially for smaller businesses or startups that might have budget constraints.
Complexity for Basic Analysis: SPSS’s robust features may be overwhelming for those only needing price sensitivity analysis, making it a less suitable option for simpler projects.

Sawtooth Software
Sawtooth Software specializes in advanced analytics and provides a suite of tools for market research, including conjoint analysis and price sensitivity meters. Its platform is particularly suitable for those requiring detailed sensitivity analysis and complex modeling. Sawtooth Software's ability to handle intricate datasets makes it an excellent choice for large-scale pricing studies.
Pros of Using Sawtooth Software:
Advanced Analytics: Sawtooth Software specializes in complex analytics, making it ideal for detailed price sensitivity analysis and modeling.
Comprehensive Tools: It offers a suite of tools for pricing research, including conjoint analysis, which can enhance the depth of price sensitivity studies.
Handling Complex Datasets: The platform can manage intricate datasets, making it suitable for large-scale pricing studies.
Cons of Using Sawtooth Software:
Cost Considerations: It may be too expensive for small businesses or startups with limited budgets.
Complexity: The advanced features may be overwhelming for users who only require price sensitivity analysis.

Microsoft Excel
Most people are already familiar with Microsoft Excel. It can be a cost-effective and powerful tool for analyzing and visualizing data collected from surveys for pricing studies.
Pros of using Microsoft Excel:
Cost-Effective: Excel is often included with Microsoft Office subscriptions that many businesses already have, making it a cost-effective option for data analysis.
Familiarity: Many users are already familiar with Excel, which can reduce the learning curve associated with adopting new software for price sensitivity analysis.
Visualization Tools: Excel offers a range of charting and graphing tools that can help visualize price curves and buyer responses effectively.
Integration Capabilities: Excel can be integrated with other tools and software to import and export data seamlessly.
Cons of using Microsoft Excel:
Complex Calculations: While Excel can handle complex analyses, users may need advanced knowledge of formulas and functions, which can be a barrier for those unfamiliar with data analysis.
Scalability Issues: As the dataset grows, Excel may struggle with large-scale data management and processing speed compared to specialized survey tools.
Potential for Human Error: Manual data entry and manipulation can lead to inaccuracies or misinterpretations of the results.
Steps to Calculate Price Sensitivity
Using statistical software to calculate the Van Westendorp Price Sensitivity Meter (PSM) involves several key steps. While various software options exist (like Q, SPSS, Sawtooth, and Excel), the general process remains consistent.
Here's how to conduct the pricing analysis using statistical software effectively:
Design and conduct a survey: A well-designed survey asks participants the four essential questions related to their pricing perceptions: At what price would you consider the product to be too expensive? At what price would you consider the product to be too cheap? At what price would you consider the product to be expensive but still a viable option? At what price would you consider the product to be good value?
Import the data: Import survey data into the statistical software as an XPS or CSV file, ensuring that each question corresponds to its respective variable in the dataset.
Data preparation: Clean and preprocess the data, if necessary. This may include checking for missing values or outliers. Create variables for each of the four price sensitivity questions.
Frequency analysis: Calculate the frequency distribution for each price point collected from the responses. This will help you understand how many respondents selected each price for each question.
Generate graphs: Use the software's graphing features to plot the responses on a price sensitivity curve. Create a line graph with price points on the x-axis and the cumulative frequency or percentage of respondents on the y-axis. Plot the four key price responses to visualize their relationships and intersections.
Calculate Key Metrics: Identify the following critical points directly from the frequency distributions and cumulative frequency curves:
Indifference Price Point: Where the "expensive" and "good value/inexpensive" lines intersect—indicating the price where the same number of respondents consider it inexpensive and expensive.
Point of Marginal Cheapness: The lowest price point where respondents do not consider the product too cheap.
Point of Marginal Expensiveness: The highest price point where respondents do not consider the product too expensive.
Optimal Price Point: The price with the least resistance, often identified as the price between the points of marginal cheapness and marginal expensiveness
Analysis and Interpretation: Analyze the results from the calculations and graphs to draw meaningful insights into pricing strategies.

Image: How to calculate price sensitivity
Challenges and Considerations
The Van Westendorp method is highly effective, but there are a number of potential challenges:
Sample Size: Ensure that the sample size is large enough to provide statistically significant results.
Market Segmentation: Different buyer segments may have varying price sensitivities, requiring tailored analyses.
External Factors: Consider external factors such as economic conditions and competitive actions that may influence price perceptions.
While DIY software solutions for adopting the Van Westendorp Price Sensitivity Meter exist, engaging a B2B market research company can significantly enhance the research process and outcomes. Their expertise in survey design, data collection, analysis, and strategic recommendations ensures that businesses can make informed and data-driven pricing decisions that optimize customer satisfaction and profitability. The agency’s resources and knowledge can help brands navigate the complexities of pricing strategies with confidence.

A leading US tire manufacturer wanted to know how much crop farmers would be willing to pay for new innovative tires.
Werk Insight, a B2B market research agency, custom-recruited 400 crop farmers from industry publications and via the phone for live interviews for a pricing research study. It asked participants about the types of tires they were buying, which brands they preferred, and how much they were willing to pay.
A Van Westerndorp analysis of the data identified the optimal price range for agricultural tires and how different prices affect demand (i.e., price sensitivity). Findings indicated how much crop farmers would be willing to pay across different types of agricultural equipment and tire positions. As a result, the company was able to establish a pricing strategy that enhanced market acceptance and profitability in a competitive context. Read the full case study here.
Conclusion: The Strategic Advantage of Price Sensitivity Analysis
As one of the common pricing research methods, incorporating the Van Westendorp Price Sensitivity Meter provides invaluable insights into pricing perceptions. Using the right statistical software tool, such as Q, SPSS, Sawtooth, or Excel, makes it easier to determine the optimal price point for a business’s products or services.
Ultimately, we find that an effective price sensitivity analysis empowers businesses to strategically price their product or service in a way that maximizes profitability and customer satisfaction.